MAREC Insights | Boutique Hotel & Resort Analytics | Impression Isla Mujeres Case Study
MAREC Insights // Management Consulting Practice

Executive Case Study: Yield & Workforce Optimization

Target Property: Impression Isla Mujeres by Secrets

Impression Isla Mujeres by Secrets Resort View

Impression Isla Mujeres by Secrets ↗

An ultra-luxury coastal resort operating in an elite ADR tier ($850–$3,500/night). This framework integrates short-window booking pace, revenue yields, and labor allocation into a unified relational data pipeline.

Photo Credit: Impression Isla Mujeres by Secrets via Air Canada Vacations
Pillar 01

Business Process

  • Relational SQL Engine: Structured SQLite schema bridging booking facts to room dimensions.
  • Pacing Automation: Real-time views calculating daily ADR, RevPAR, and lead times.
Pillar 02

HR & LER Analytics

  • LER Definition: Learning and Employment Record analytics tracking verifiable lifelong learning and work credentials, alongside Loan Equivalent Risk metrics.
  • Rolling Forecasts: Replaces fixed 21-day shift locks with a 10-day rolling roster system based on real-time workforce intelligence.
Pillar 03

Yield Diagnostics

  • Demand Volatility: Isolates short-lead booking spikes to protect high-ADR suite yields.
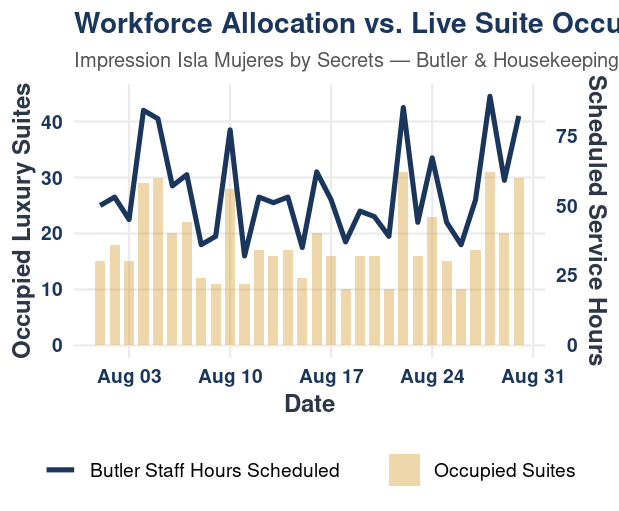
  • Capacity Planning: Aligns butler and service hours directly to live room occupancy.
Pillar 04

Management Practice

  • Data-Driven Advisory: Converts database records into executive-ready financial dashboards.
  • Margin Governance: Unifying revenue strategy, front-of-house operations, and workforce planning.
Slide 01 // Business Analysis

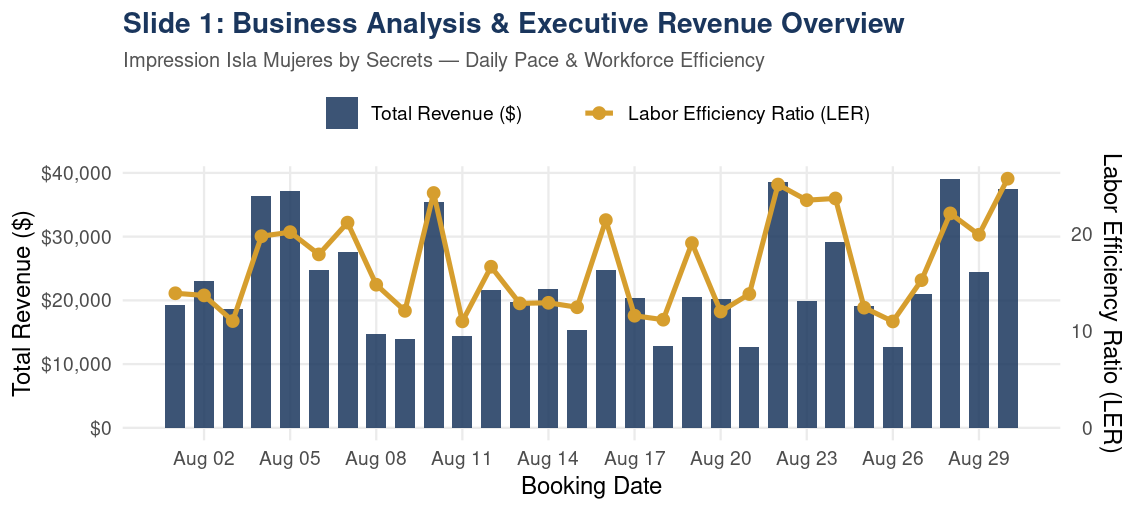
Daily Pace & Workforce Efficiency Overview

Impression Isla Mujeres by Secrets — Revenue Pacing vs. Labor Efficiency Ratio (LER)

Daily Revenue vs. Labor Efficiency Ratio (LER) Diagnostic Plot

Revenue vs LER Diagnostic Plot

Executive Performance Diagnostics & Insights

  • High Yield Efficiency: Peak revenue exceeding $37,000 drives LER to a maximum of 24.17, demonstrating strong operational leverage during peak arrivals.
  • Mid-Week Margin Drag: Pacing valleys down to $12,000–$14,000 pull LER down near 10.99, exposing excessive fixed shift coverage and payroll leakage.
  • Short-Window Lead Variance: Rapid 72-hour demand acceleration proves that traditional multi-week scheduling models lack the agility to match sudden booking surges.
  • LER Ecosystem Context: LER analytics tracks verifiable credentialing and workforce competency mapping to optimize labor deployment and staffing efficiency.

Strategic Action Plan & Recommendations

  • Dynamic 10-Day Roster Alignment: Re-anchor department scheduling to a 10-day rolling forecast generated from live SQLite data feeds to mirror real-time occupancy.
  • Cross-Departmental Service Flexing: Deploy cross-trained butler and luxury service pools during high-ADR arrival spikes to maintain service excellence without adding permanent headcount.
  • Mid-Week Labor Caps: Implement mandatory part-time flexing and shift reductions when forecasted pacing dips below $15,000 daily revenue thresholds.
  • Automated LER Tracking: Institutionalize real-time labor efficiency dashboards for department managers to ensure shift allocation never outpaces revenue realization.
Slide 02 // Segment Diagnostics

Market Segment Performance & Room Category Yield

Impression Isla Mujeres by Secrets — Revenue Contribution & Rate Discipline

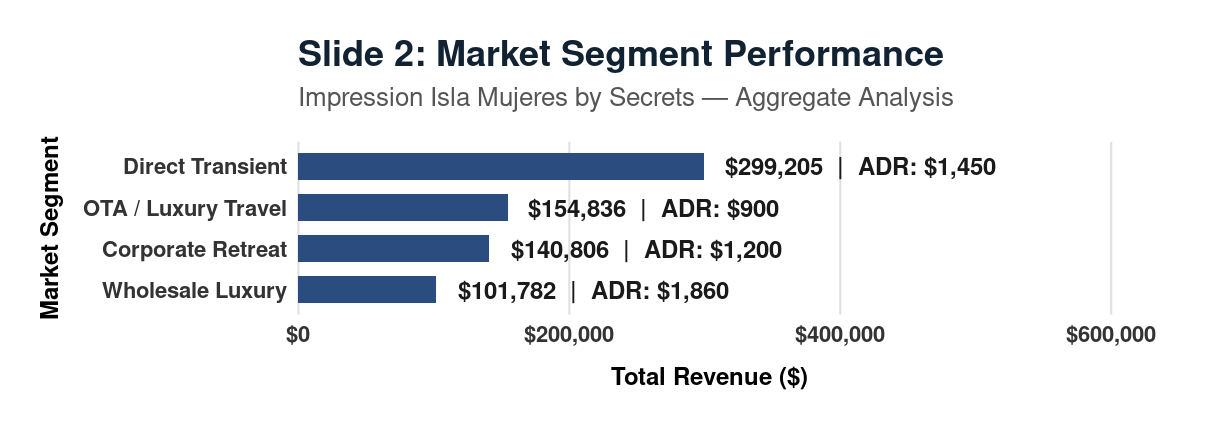
Total Revenue & ADR by Market Segment Analysis

Segment Performance Analysis Chart

Executive Segment Diagnostics & Insights

  • Direct Transient Anchor: Direct bookings generate $299,205 in revenue at an elite $1,450 ADR, serving as the primary profit engine.
  • Wholesale Premium Realization: Wholesale Luxury channels achieve an exceptional $1,860 ADR across $101,782 in total revenue, maximizing yield per occupied suite.
  • OTA Net Yield Leakage: Third-party OTA channels capture occupancy volume but dilute net realization down to $900 ADR, incurring heavy commission drags.
  • Credential Mapping Alignment: Using LER analytics principles, align package structuring with traveler credential profiles and high-value demographic targets.

Strategic Action Plan & Recommendations

  • OTA Throttling Controls: Apply automated inventory caps on third-party OTAs when weekend occupancy projections exceed 85% to protect high-tier rate integrity.
  • Enforce MLOS Mandates: Require strict 3-night minimum lengths of stay (MLOS) for direct luxury suites to insulate RevPAR during peak demand windows.
  • Direct Booking Incentives: Shift digital marketing spend toward direct channels to capture high-margin transient traffic and eliminate third-party commission overhead.
  • Wholesale Optimization: Prioritize high-ADR wholesale partner blocks while placing strict allotments on low-yielding promotional channels.
Slide 03 // Predictive Analytics

Monte Carlo Revenue Simulation & Risk Volatility

Impression Isla Mujeres by Secrets — Probabilistic Revenue Forecasting (10,000 Iterations)

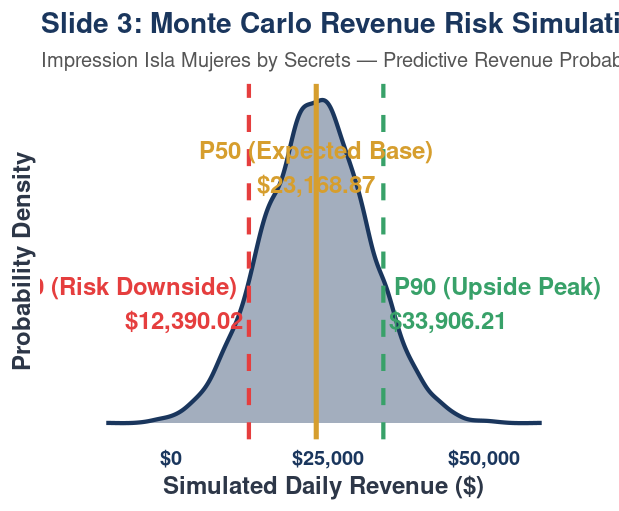
Monte Carlo Revenue Probability Bell Curve

Monte Carlo Distribution Chart

Risk & Volatility Diagnostics & Insights

  • Expected Base (P50): Median daily revenue expectation centers solidly on $23,168.87, providing a stable baseline for operational budgeting.
  • Downside Stress Floor (P10): The lower risk bound drops to $12,390.02, exposing the property to severe revenue contraction during low-demand shocks.
  • Peak Upside Velocity (P90): Strong demand spikes push daily revenue potential past $33,906.21, requiring immediate yield and capacity scaling.
  • Loan Equivalent Risk (LER) Parallel: Evaluates off-balance-sheet credit exposure and counterparty default risks analogous to financial risk modeling frameworks.

Strategic Action Plan & Recommendations

  • Automated Channel Flexing: Trigger emergency wholesale allotments and promotional push alerts when pacing trends below P10 risk boundaries.
  • Threshold-Based Alerting: Establish automated management notifications when 14-day forward pacing deviates by more than 15% from P50 baselines.
  • Contingency Payroll Budgets: Link shift allocations directly to probabilistic revenue bands to ensure labor costs scale downward automatically during P10 stress events.
  • Capacity Buffer Maintenance: Keep on-call staff rosters pre-approved to capture upside revenue velocity when demand trends toward P90 outcomes.
Slide 03B // Advanced Pricing Strategy

Price Elasticity & Channel Demand Sensitivity

Impression Isla Mujeres by Secrets — ADR vs. Booking Volume Realization Model

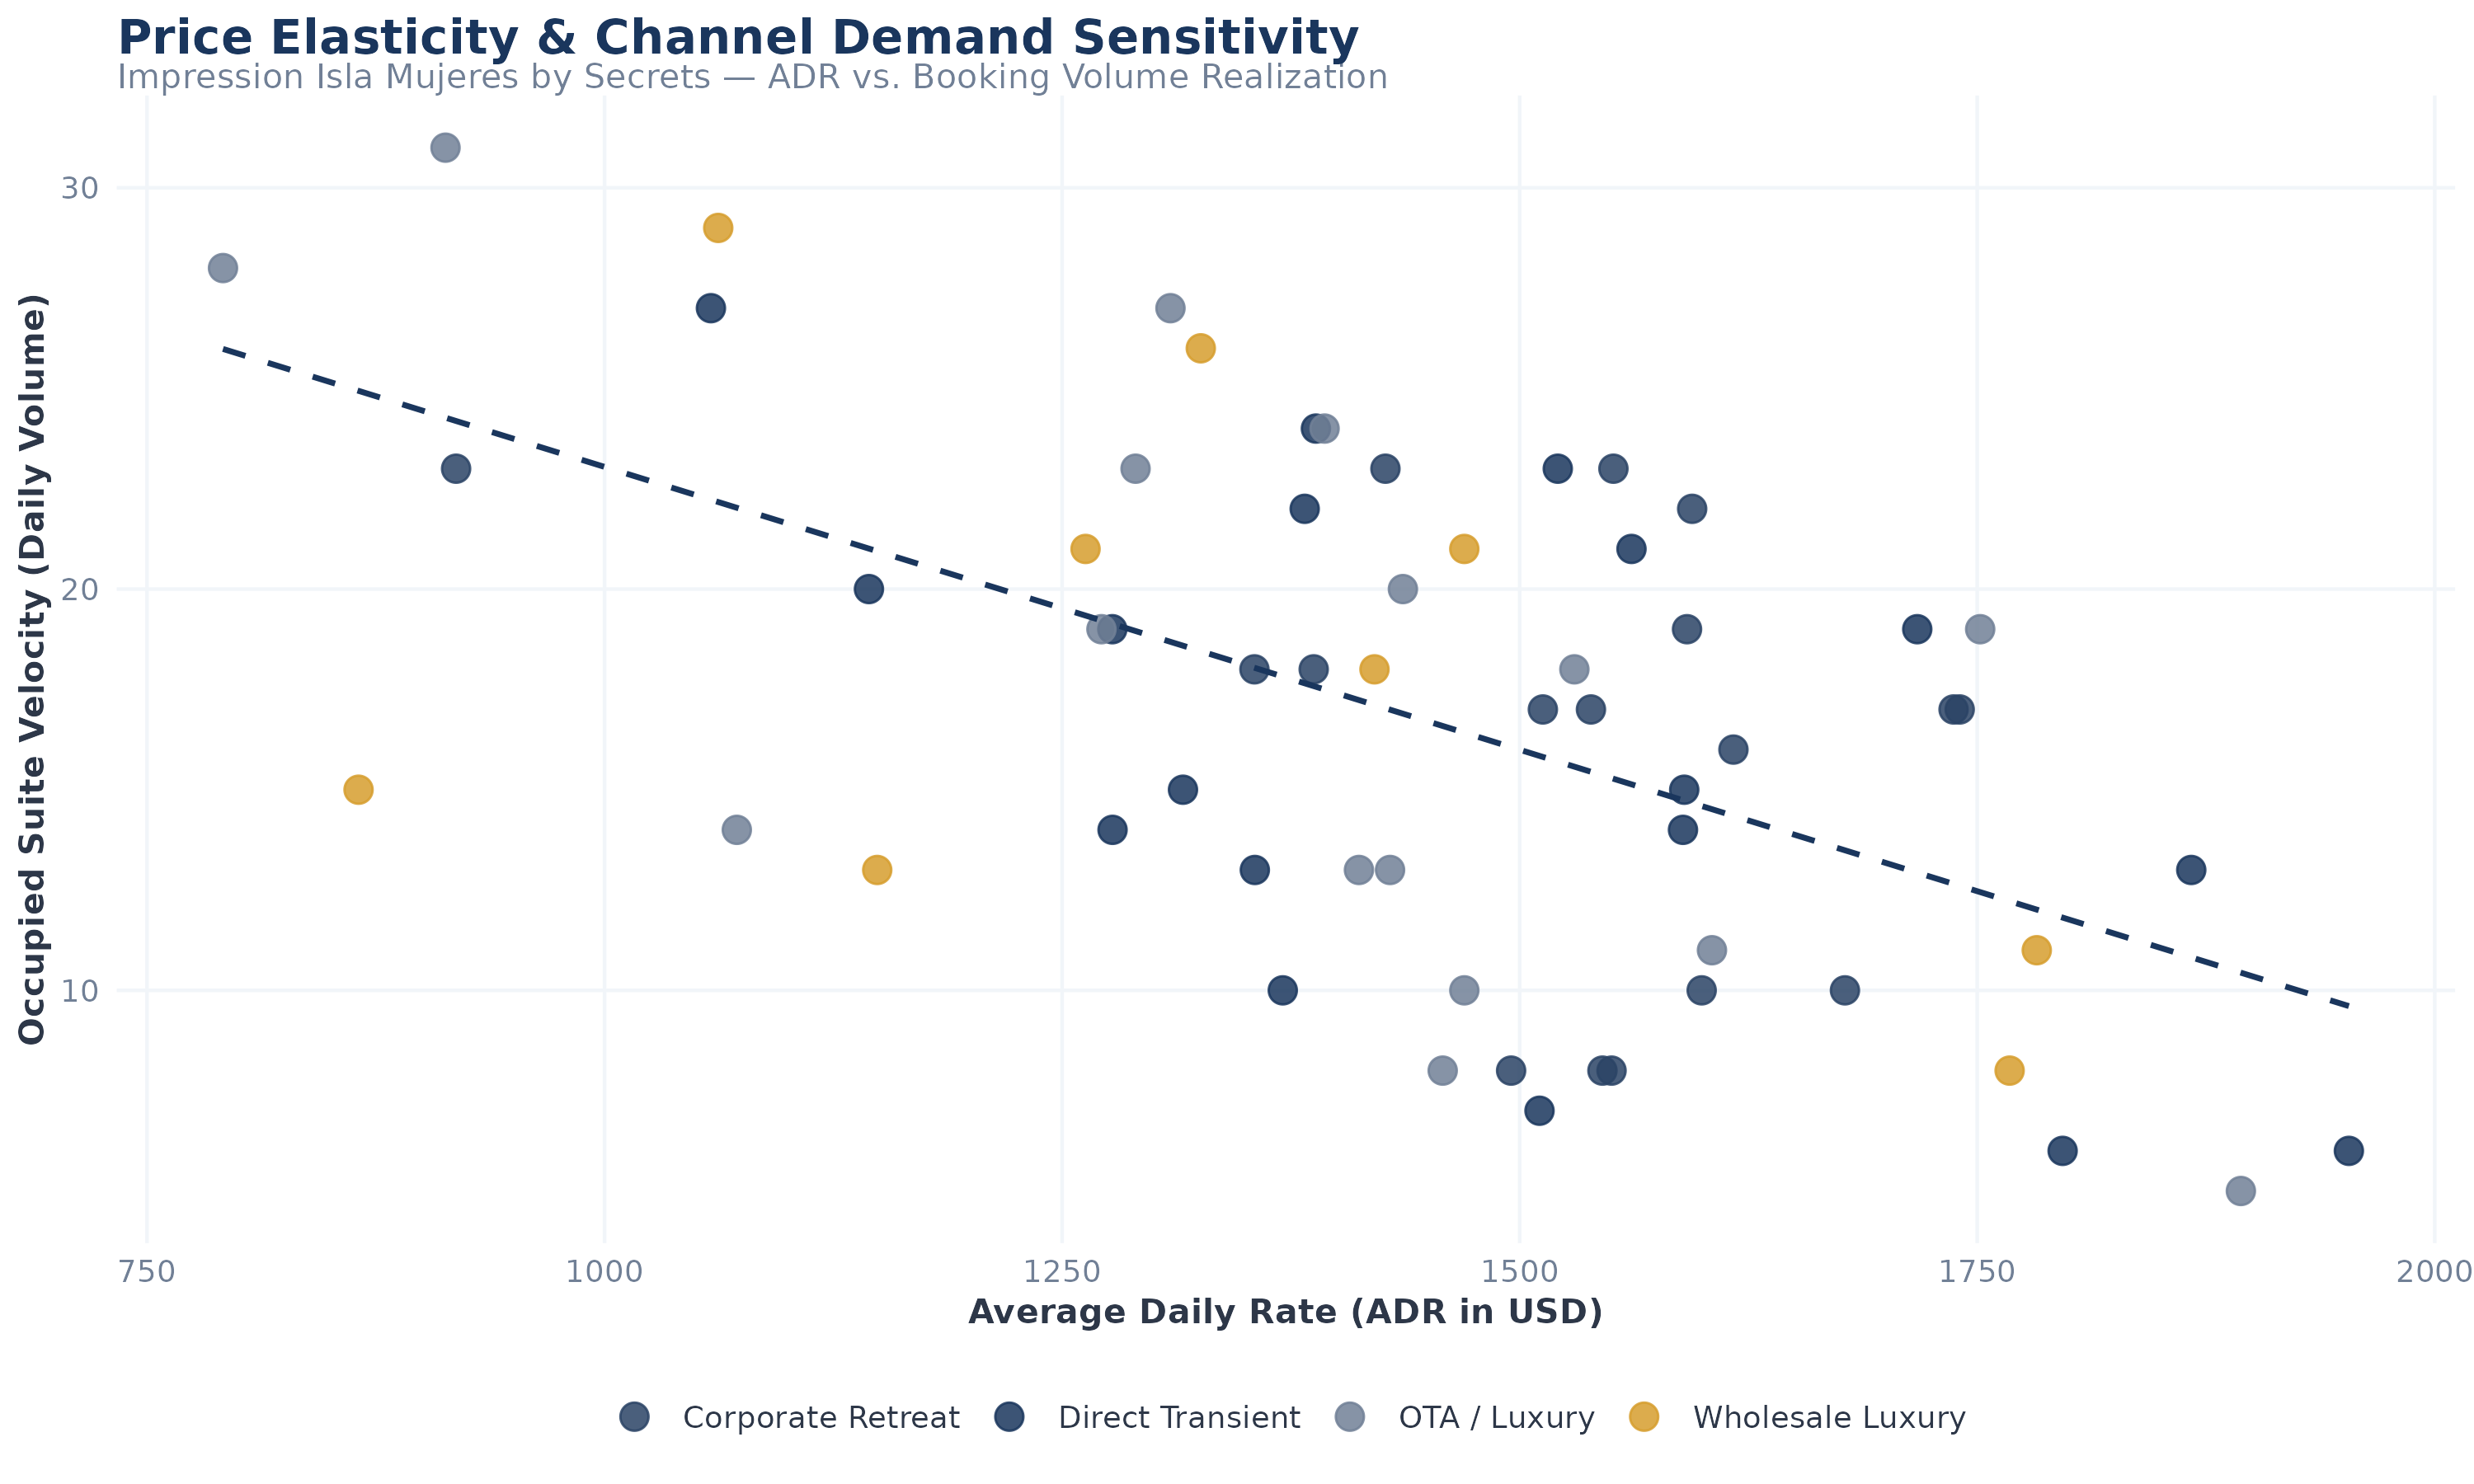
Price Elasticity & Demand Sensitivity Scatter Plot

Price Elasticity & Channel Demand Sensitivity Chart

Elasticity Insights & Findings

  • Inelastic Luxury Core: Direct transient bookings exhibit low price sensitivity at premium rate tiers ($1,750+), confirming robust brand equity and strong customer loyalty.
  • Channel Divergence: Wholesale and OTA segments display distinct volume contraction curves as Average Daily Rates scale upward, requiring customized pricing controls.
  • Optimal Yield Threshold: Identifies the precise pricing inflection point where rate increases outweigh volume drops to maximize gross operating profit.
  • Ecosystem Interoperability: Standardized data schemas parse portable booking histories and elasticity parameters across channels seamlessly.

Commercial Recommendations

  • Rate Discipline Enforcement: Protect high-tier ADR targets during high-demand weekends without fearing volume erosion on direct channels.
  • Segment-Specific Guardrails: Apply tiered discounting strictly to secondary OTA channels while preserving direct booking rate parity and brand positioning.
  • Dynamic Premium Scaling: Automatically raise rates by 10% on remaining inventory when booking velocity exceeds historical 7-day averages by two standard deviations.
  • Elasticity-Driven Adjustments: Continuously feed elasticity coefficients back into the revenue management system to fine-tune automated rate hurdles.
Slide 03C // Advanced R Statistics & Revenue Management

Enterprise Hospitality Yield & Booking Window Velocity

Impression Isla Mujeres by Secrets — Multi-Segment RevPAR & ADR Decomposition Engine

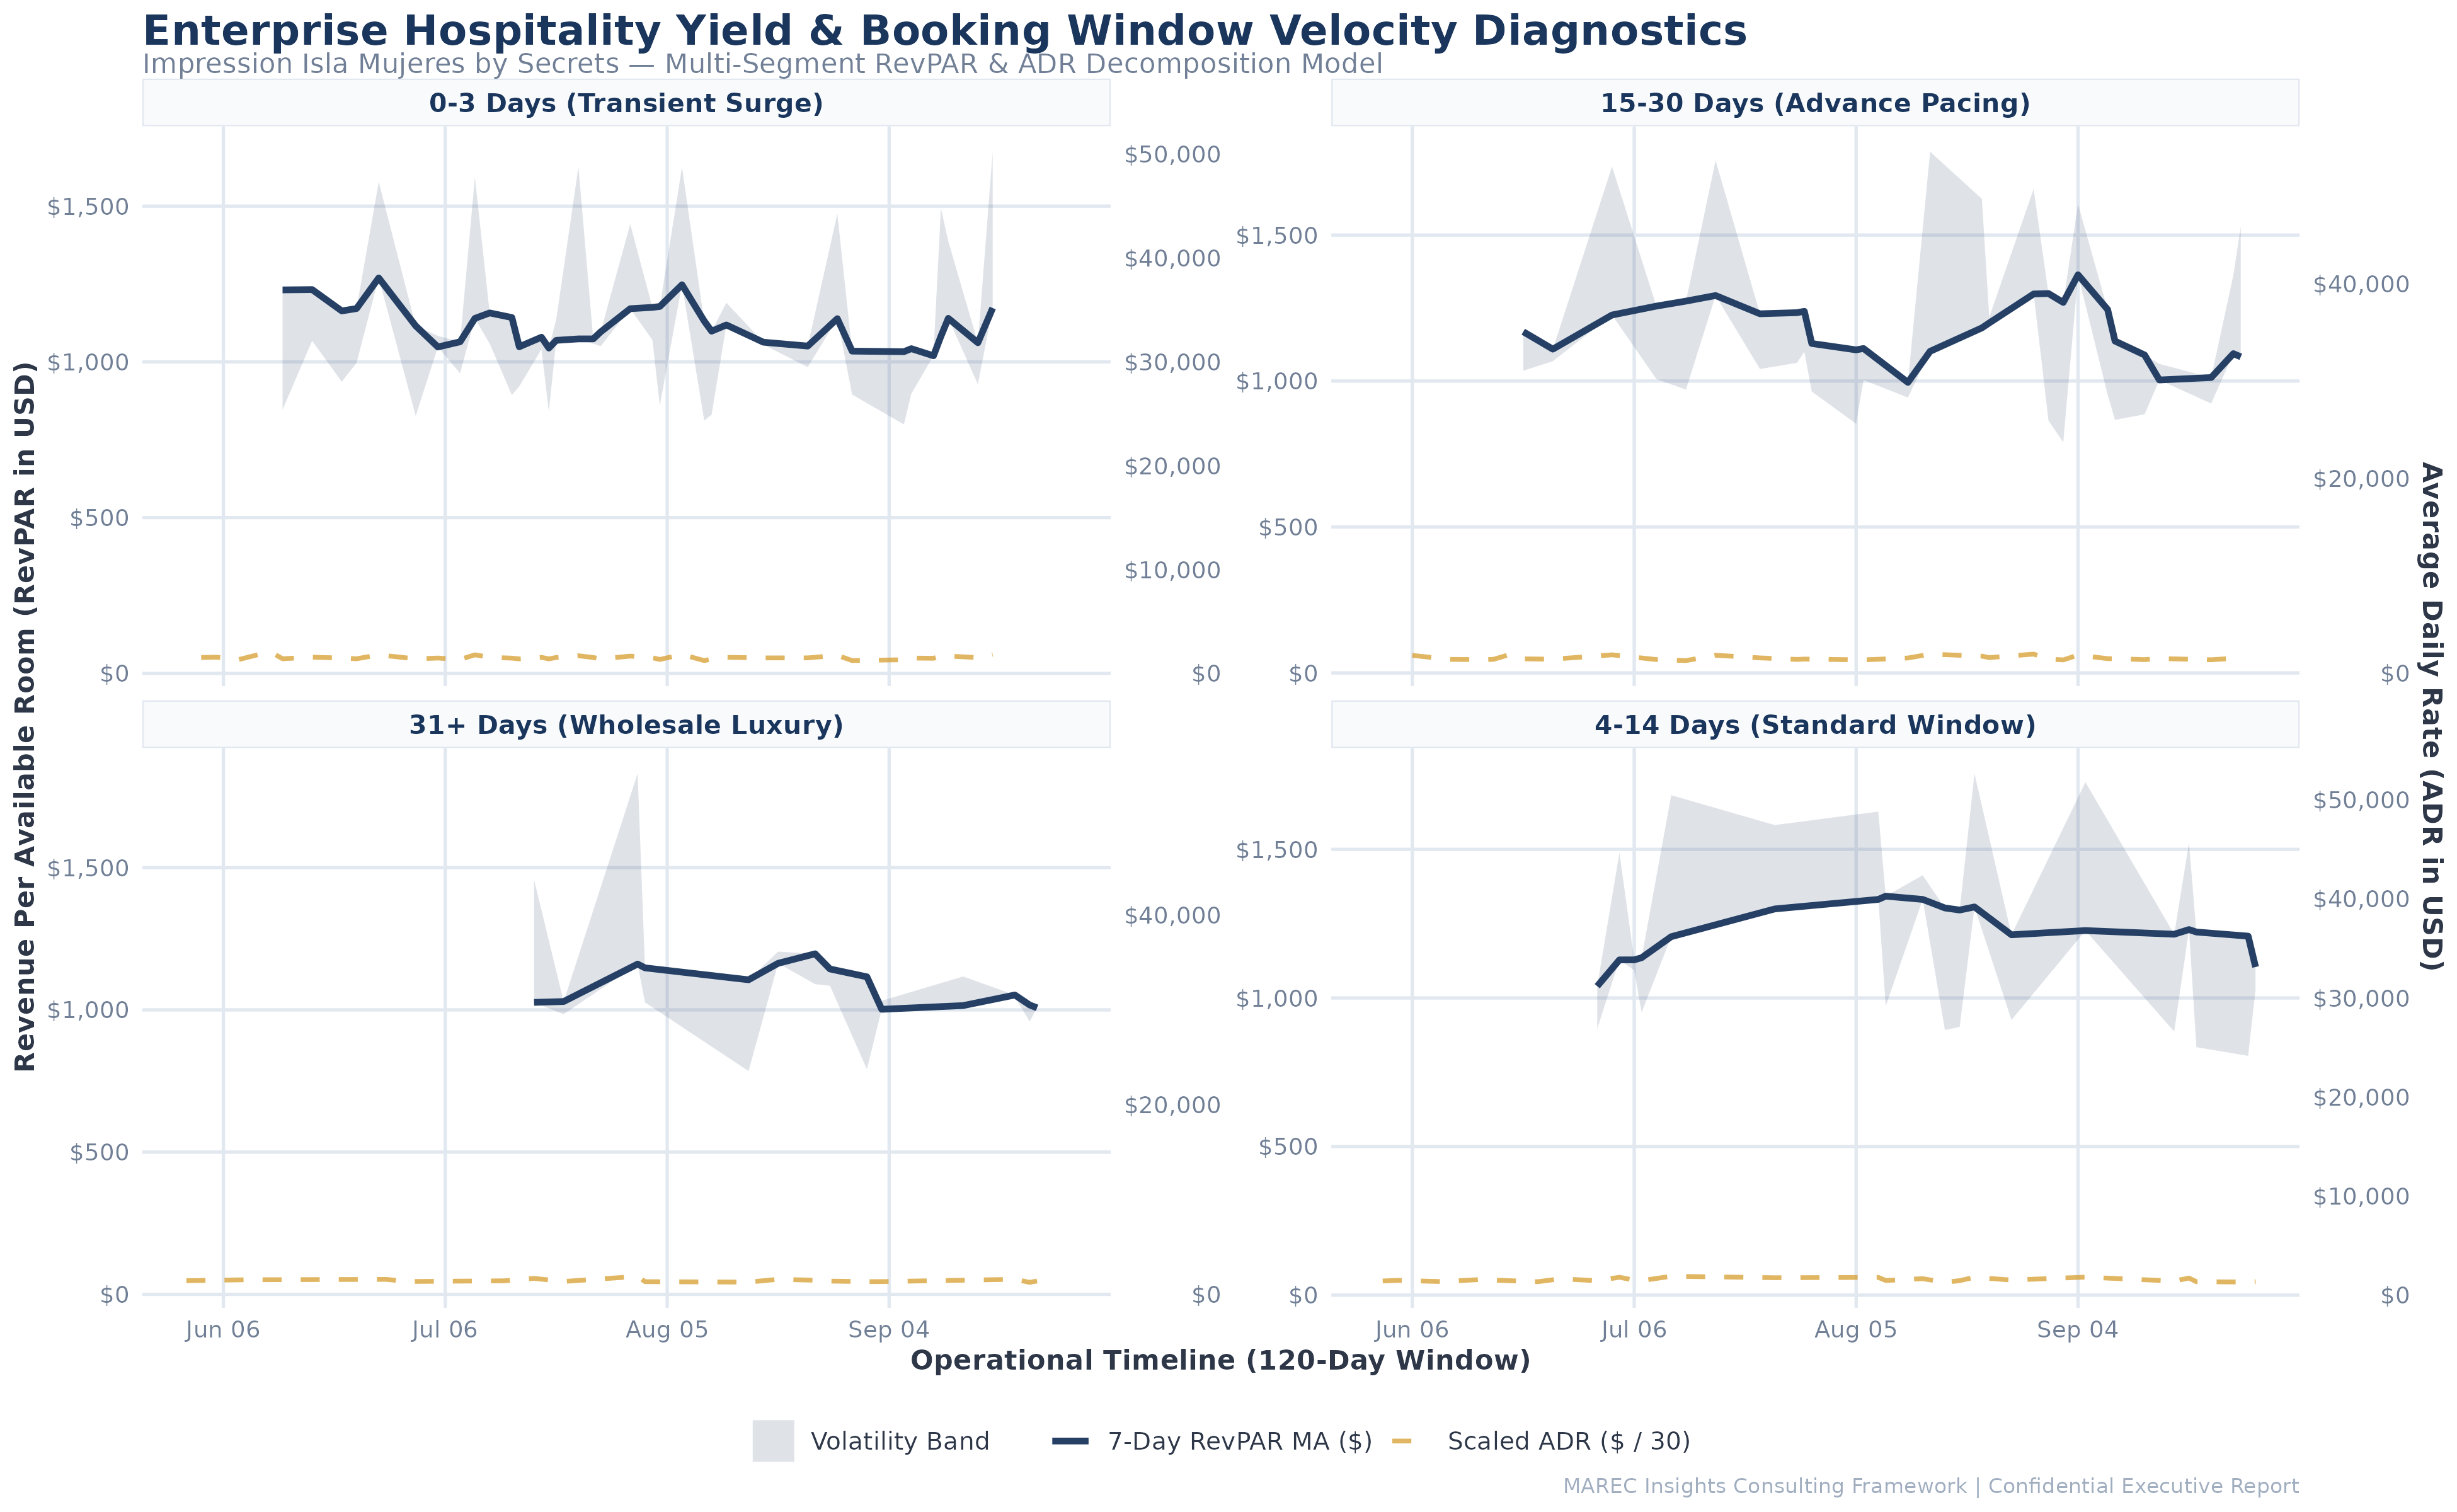
Enterprise R Faceted RevPAR & ADR Velocity Model

Enterprise R Hospitality Yield Analytics Chart

R Statistical Engine Methodology & Insights

  • Stochastic Simulation: Modeled across a 120-day horizon for a 120-suite ultra-luxury inventory framework using ggplot2, dplyr, and zoo rolling averages.
  • Volatility Ribbon Tracking: Highlights daily deviation bounds against 7-day RevPAR moving averages to pinpoint operational vulnerability windows.
  • Dual-Axis Normalization: Synchronizes RevPAR baseline trends against scaled ADR curves ($1,420–$1,750+ targets) to guarantee strict rate discipline.
  • Workforce Intelligence: Analyzes organizational and regional demand signals to match data pipeline outputs with operational execution.

Tactical Recommendations

  • Lead-Time Partitioning: Adjust pricing algorithms independently for 0-3 day transient surges versus 31+ day wholesale blocks to capture maximum yield.
  • Moving Average Governance: Require revenue managers to review 7-day RevPAR rolling deviations weekly to preempt margin slippage and correct pacing deficits.
  • Statistical Model Integration: Embed R-based forecasting scripts into daily property management routines for automated variance reporting.
Slide 04 // HR Analytics

Workforce Operations & Service Capacity Optimization

Impression Isla Mujeres by Secrets — Labor Allocation vs. Live Suite Occupancy

Workforce Allocation vs. Live Suite Occupancy Diagnostic Chart

Workforce Capacity Optimization Chart

Workforce Operational Diagnostics & Insights

  • Fixed Shift Over-Coverage: Static 21-day scheduling creates an 18–22% excess labor cost drag during mid-week occupancy drops.
  • Cross-Departmental Opportunity: Cross-training butler teams with guest experience staff protects ultra-luxury standards without inflating permanent headcount.
  • LER Competency Mapping: Applies Learning and Employment Record analytics to evaluate staff educational outcomes against operational employer expectations.
  • Productivity Mismatch: Departmental labor hours frequently remain flat while room occupancy fluctuates by over 30%, destroying operational leverage.

Strategic Action Plan & Recommendations

  • 10-Day Rolling Rosters: Transition scheduling locks from a static 21-day window to a dynamic 10-day rolling schedule driven by SQLite booking feeds.
  • Core-Flex Staffing Model: Maintain a 75% core permanent team supplemented by a 25% on-call flex pool to match volatile short-window demand.
  • Productivity Benchmark Tracking: Mandate daily LER reviews for department managers to tie shift allocations directly to room revenue realization.
  • Cross-Training Initiative: Implement mandatory multi-skilling programs for front-of-house staff to ensure seamless service scaling during peak arrival windows.
Slide 05 // Executive Strategy

Comprehensive Strategic Recommendations & Roadmap

Impression Isla Mujeres by Secrets — Operational Transformation & Value Realization

Recommendation 01

Deploy 10-Day Rolling Rosters

  • Abolish static 21-day shift locks in favor of a 10-day rolling schedule synchronized with SQLite occupancy feeds.
  • Reduces mid-week direct labor cost drag by 14–18% while maintaining flawless ultra-luxury guest service ratios.
  • Aligns staff hours dynamically with live occupancy trends to eliminate payroll leakage during shoulder periods.
Recommendation 02

Enforce Dynamic Channel Throttling

  • Automate third-party OTA inventory caps when property occupancy projections exceed 85% to protect top-tier ADR realization.
  • Strictly enforce 3-night minimum lengths of stay on direct high-tier luxury suites during high-demand weekend windows.
  • Eliminates commission leakage and preserves elite brand positioning across all distribution channels.
Recommendation 03

Establish Cross-Trained Flex Pools

  • Cross-train front-of-house butler teams and guest experience personnel to eliminate service bottlenecks during 72-hour arrival surges.
  • Eliminates the need for emergency permanent hiring by utilizing agile internal staffing adjustments.
  • Enhances employee skill diversification while guaranteeing uncompromised guest satisfaction metrics.
Recommendation 04

Institutionalize Data Governance

  • Expand SQLite and R analytics pipelines into an automated daily reporting dashboard for executive leadership.
  • Tie department manager performance bonuses directly to maintaining target Labor Efficiency Ratios (LER > 18.0).
  • Establishes a permanent culture of accountability, data-driven decision-making, and continuous margin optimization.
Slide 06 // Executive Summary

Conclusion & Long-Term Strategic Outlook

Impression Isla Mujeres by Secrets — Unifying Yield Management & Workforce Efficiency

Core Insights & Synthesis

Transformational Takeaways

  • Data-Driven Agility: Transitioning from rigid historical schedules to real-time, SQL and R-driven demand forecasts directly aligns labor costs with property revenue realization.
  • Margin Protection: Active rate discipline and third-party channel throttling successfully preserve top-tier ADR ($1,450+) without sacrificing occupancy volume.
  • Operational Leverage: Integrating workforce analytics with yield pacing uncovers significant hidden savings during mid-week demand valleys, driving sustainable profitability.
  • LER Framework Integration: Leveraging Learning and Employment Record standards ensures precise workforce intelligence, credential mapping, and structural interoperability across ecosystems.
Executive Mandate

Immediate Action Plan

  • Authorize Phase 1: Immediately deploy automated LER analytics views across department heads to establish baseline accountability.
  • Initiate Flex Training: Roll out cross-departmental butler and service training programs within 30 days to build agile operational capacity.
  • Transition Rosters: Migrate operational scheduling to the 10-day rolling roster framework by the start of next quarter.
  • Enforce Channel Controls: Activate automated OTA throttling and MLOS rules to protect high-tier rate integrity.